Archive
Monitoring AKS Windows node pools
Monitoring your containers is critical, especially when you’re running a production cluster, at scale, with multiple applications. Currently in Preview, the Azure Monitor for Containers will automatically start to collect logs (std/stderr) on the containers running on Azure Kubernetes Service (AKS)
This will provide you end-to-end monitoring on AKS Windows node pools with logs and metrics (which is already supported).

With Azure Monitor for containers you can:
- Identify AKS containers that are running on the node and their average processor and memory utilization. This knowledge can help you identify resource bottlenecks.
- Identify processor and memory utilization of container groups and their containers hosted in Azure Container Instances.
- Identify where the container resides in a controller or a pod. This knowledge can help you view the controller’s or pod’s overall performance.
- Review the resource utilization of workloads running on the host that are unrelated to the standard processes that support the pod.
- Understand the behavior of the cluster under average and heaviest loads. This knowledge can help you identify capacity needs and determine the maximum load that the cluster can sustain.
- Configure alerts to proactively notify you or record it when CPU and memory utilization on nodes or containers exceed your thresholds, or when a health state change occurs in the cluster at the infrastructure or nodes health rollup.
- Integrate with Prometheus to view application and workload metrics it collects from nodes and Kubernetes using queries to create custom alerts, dashboards, and detailed perform detailed analysis.
- Monitor container workloads deployed to AKS Engine on-premises and AKS Engine on Azure Stack.
- Monitor container workloads deployed to Azure Red Hat OpenShift.
Fore more information see: https://docs.microsoft.com/en-us/azure/azure-monitor/insights/container-insights-overview
Extending Microsoft OMS to monitor Squid Proxy running in Linux with a plugin – part 1/3 #MSOMS
Since Microsoft released OMS, I have been an early adopter and evangelist for the solution. Not only it is simple to deploy but it gives you a full spectrum of many of the workloads you have either on-premises or in the cloud and it does not matter which cloud. Be it Azure, AWS, Google and many others.
So, as I was advising on OMS for a customer, I found that they were running Squid Proxy servers. The Squid proxy server is one of the most famous proxy servers in the world and it has been utilised for years in many organisations. For that reason I then I decided to look at how OMS could leverage the monitoring for Squid.

As you can see here: https://github.com/Microsoft/OMS-Agent-for-Linux/tree/master/installer/conf/omsagent.d there are already many plugins for OMS to monitor Windows and many Linux OS as well, DNS, Network, SQL, MySQL, Postgree, VMware, MongoDB, Security, Audit, Change Tracking and so on.
But, there was no Squid plugin and that’s where I brought back my past years of experience as a developer and although that was a long, long time go, I was able to developer in ruby a Squid plugin for Microsoft OMS.
How I developed it?
PART 1 : LOG Files
- I started but investigating the squid log on /var/log/squid/access.log and then I research REGEX expressions to extract information out of it. Below is a extract of it
1479696836.902 134 10.1.1.4 TCP_MISS/301 488 open http://cnn.com/ – HIER_DIRECT/151.101.0.73 –
1479696848.110 242 10.1.1.4 TCP_MISS/400 486 open http://www.sydney.com/ – HIER_DIRECT/54.253.253.77 text/html
1479696860.004 407 10.1.1.4 TCP_MISS/301 636 open http://www.7news.com.au/ – HIER_DIRECT/203.84.217.229 text/html
The initial difficult part for me was of to decouple the date/time to get it on a human readable format. So, after long hours of research and playing along, I decided for the following REGEX :
- I then wrote a squidparserlog.rb in ruby to parse the Squid access.log file and turn it into a OMS format
class SquidLogParserLib
require ‘date’
require ‘etc’
require_relative ‘oms_common’
require ‘fluent/parser’def initialize(error_handler)
@error_handler = error_handler
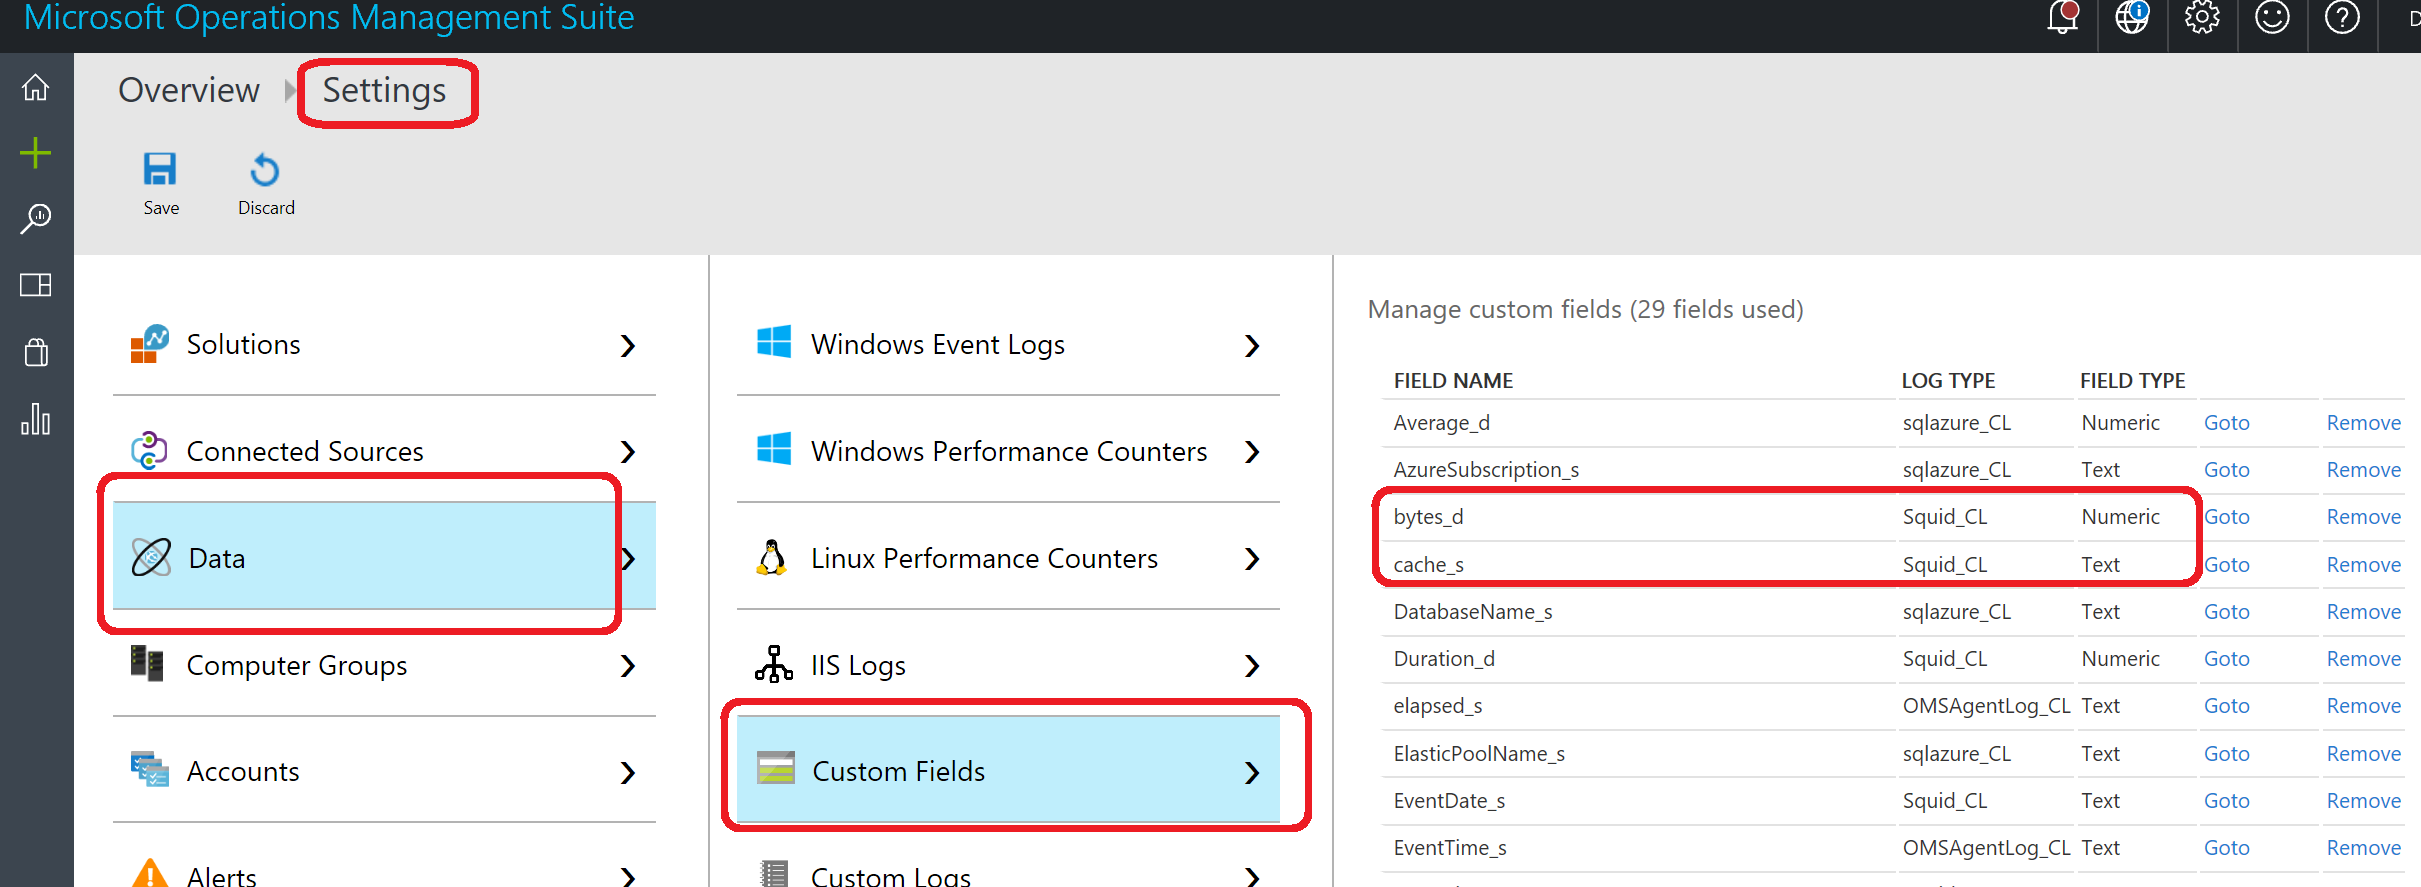
endREGEX =/(?<eventtime>(\d+))\.\d+\s+(?<duration>(\d+))\s+(?<sourceip>(\d+\.\d+\.\d+\.\d+))\s+(?<cache>(\w+))\/(?<status>(\d+))\s+(?<bytes>(\d+)\s+)(?<response>(\w+)\s+)(?<url>([^\s]+))\s+(?<user>(\w+|\-))\s+(?<method>(\S+.\S+))/def parse(line)data = {}
time = Time.now.to_fbegin
REGEX.match(line) { |match|
data[‘Host’] = OMS::Common.get_hostnametimestamp = Time.at( match[‘eventtime’].to_i() )
data[‘EventTime’] = OMS::Common.format_time(timestamp)
data[‘EventDate’] = timestamp.strftime( ‘%Y-%m-%d’ )
data[‘Duration’] = match[‘duration’].to_i()
data[‘SourceIP’] = match[‘sourceip’]
data[‘cache’] = match[‘cache’]
data[‘status’] = match[‘status’]
data[‘bytes’] = match[‘bytes’].to_i()
data[‘httpresponse’] = match[‘response’]
data[‘bytes’] = match[‘bytes’].to_i()
data[‘url’] = match[‘url’]
data[‘user’] = match[‘user’]
data[‘method’] = match[‘method’]}
rescue => e
@error_handler.logerror(“Unable to parse the line #{e}”)
endreturn time, data
end #defend #class
<source>
type tail
format SquidLogParser
path /var/log/squid/access.log
pos_file /var/opt/microsoft/omsagent/state/var_log_squid_access.pos
tag oms.api.Squid
log_level error
</source>

On my next article I will go through the next part, which is getting Squid Proxy Statistics in OMS, along with the full code.

Supercharging performance of your Hyper-V
If you are an expert in Hyper-V or just started playing with it, I recommend you download the Hyper-V ebook provided by Altaro.
The ebook is divided in 2 sections: (1) Diagnosing and Remediating Performance Issues and (2) Planning is Better than Remediation.
It will help you better plan your next Hyper-V deployment and how could you make the most of your existing deployment, through practical hands-on tips as well as background information you will learn how Hyper-V (and virtualization in general) affects performance and how to find issues in storage, CPU, memory and network components. This is followed by a look at planning hosts, VMs, storage, networking and management for maximum performance.
What the book covers:
- Diagnosing and remediating Storage, CPU, Memory, and Network performance issues
- Using Windows Performance Monitor and PAL to facilitate system and VM monitoring
- Manage planning of Hosts, VMs, Storage, Networking, to minimize the risk of performance issues
SCOM 2007 R2 : Monitoring Pack for Windows Azure
The Windows Azure Monitoring Management Pack enables you to monitor the availability and performance of applications that are running on Windows Azure.
After configuration, the Windows Azure Monitoring Management Pack offers the following functionality:
- Discovers Windows Azure applications.
- Provides status of each role instance.
- Collects and monitors performance information.
- Collects and monitors Windows events.
- Collects and monitors the .NET Framework trace messages from each role
instance. - Grooms performance, event, and the .NET Framework trace data from Windows
Azure storage account. - Changes the number of role instances via a task
System Center Monitor version : System Center Operations Manager 2007 R2 CU3 or newer
More detalis : http://www.microsoft.com/download/en/details.aspx?displaylang=en&id=11324


